Stephan Schmidt - March 22, 2024
Goals are a Spectrum not a Number
How everyone does OKRs wrong
TL;DR: Traditional single-number goals (including OKR stretch goals) create evaluation ambiguity—someone hitting 43% of a 45% target failed technically but may deserve promotion. Replace single targets with three thresholds: Astonishing (50%+, annual promotion-worthy), Exceed (45%+, bonus-worthy), Ok (40-45%, no action), and Fail (<40%, performance issue), making performance evaluation and compensation decisions objective and color-coded for leadership visibility.
Everyone does goal metrics wrong, including the KR part of OKRs. Managers agree on or are setting goals as numbers to make them verifiable. Say this feature should, after three months, be used by 45% of daily active users. Perhaps in the discussion, those managers - you! - agreed on 40% of daily active users as a goal to decide if the feature is a success. And the CEO wanted to get every to work really hard, threw in “stretch goal,” and now it’s 45% as a goal. And people need to stretch to reach it.
The feature reaches 43% usage. Is it a success? Should the person in charge, the Directly Responsible Individuals (DRI) be promoted next time? They failed the goal. And they will probably fail the next stretch goal. That is the intention of stretch goals. But if someone fails all their goals, promote them? Give them a huge salary increase or bonus?
A better way for goals is to define three numbers. I took this idea from “One Page Management,” a book from 1986 that tries to convince managers to use computers in companies.
The first number is the “Astonishing” number. In this example, we would set it at 50%. If 50% of daily active users use the feature, it’s an astonishing accomplishment.
The second goal number is the “Exceed” number. In this example, we would set it at 45%. If 45% of daily active users use the feature, we have exceeded our goal.
The third number is the “Ok” and “Fail” point. In this example, we would set it to 40%. So from 40% to 45% the feature would be ok. Not great, not bad, ok.
Below 40% the goal is failed.
With these three numbers, it’s much easier to evaluate goal performance.
- Above 50%: Astonishing, everyone is very, very happy. This is happening once a year and needs to be celebrated. The DRI will be promoted.
- Above 45%: Exceed, this is great. If a DRI produces several “Exceeds” in a year, the person will get a salary increase and bonus.
- Between 40% and 45%: Ok, no one gets promoted, no salary increase, but you’re also not going to be fired.
- Below 40%: Fail. If the DRI has several Fails in a year, the person needs to look for another job,they are not the right person for this job.
From the above example, 43% would be ok. Nothing to rave about, but also nothing to take action for.
This way people know where they are standing, what they need to achieve. You can track those in a simple Excel sheet. Blue for astonishing, green for exceeding, yellow for ok, red for fail. Each column is a goal, each row a DRI. Then it’s easy to see at first glance how people are performing, whom to promote.
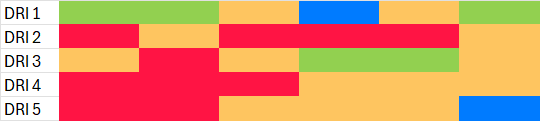
DRI 5 is someone who fails but also creates crazy success. DRI 1 clearly is the best goal achiever. DRI 2 and DRI 4 need a talk about goal achievements. DRI 3 is the average employee with some success and some failures.
Why are you still using one number to express a spectrum?
More Stuff from Stephan


About me: Hey, I'm Stephan, I help CTOs with Coaching, with 40+ years of software development and 25+ years of engineering management experience. I've coached and mentored 100+ CTOs and founders. I've founded 3 startups. 1 nice exit. I help CTOs and engineering leaders grow, scale their teams, gain clarity, lead with confidence and navigate the challenges of fast-growing companies.
Most of the CTOs I coach didn't know CTO coaching was a thing until they were already drowning. It is a thing - here's what it is.